
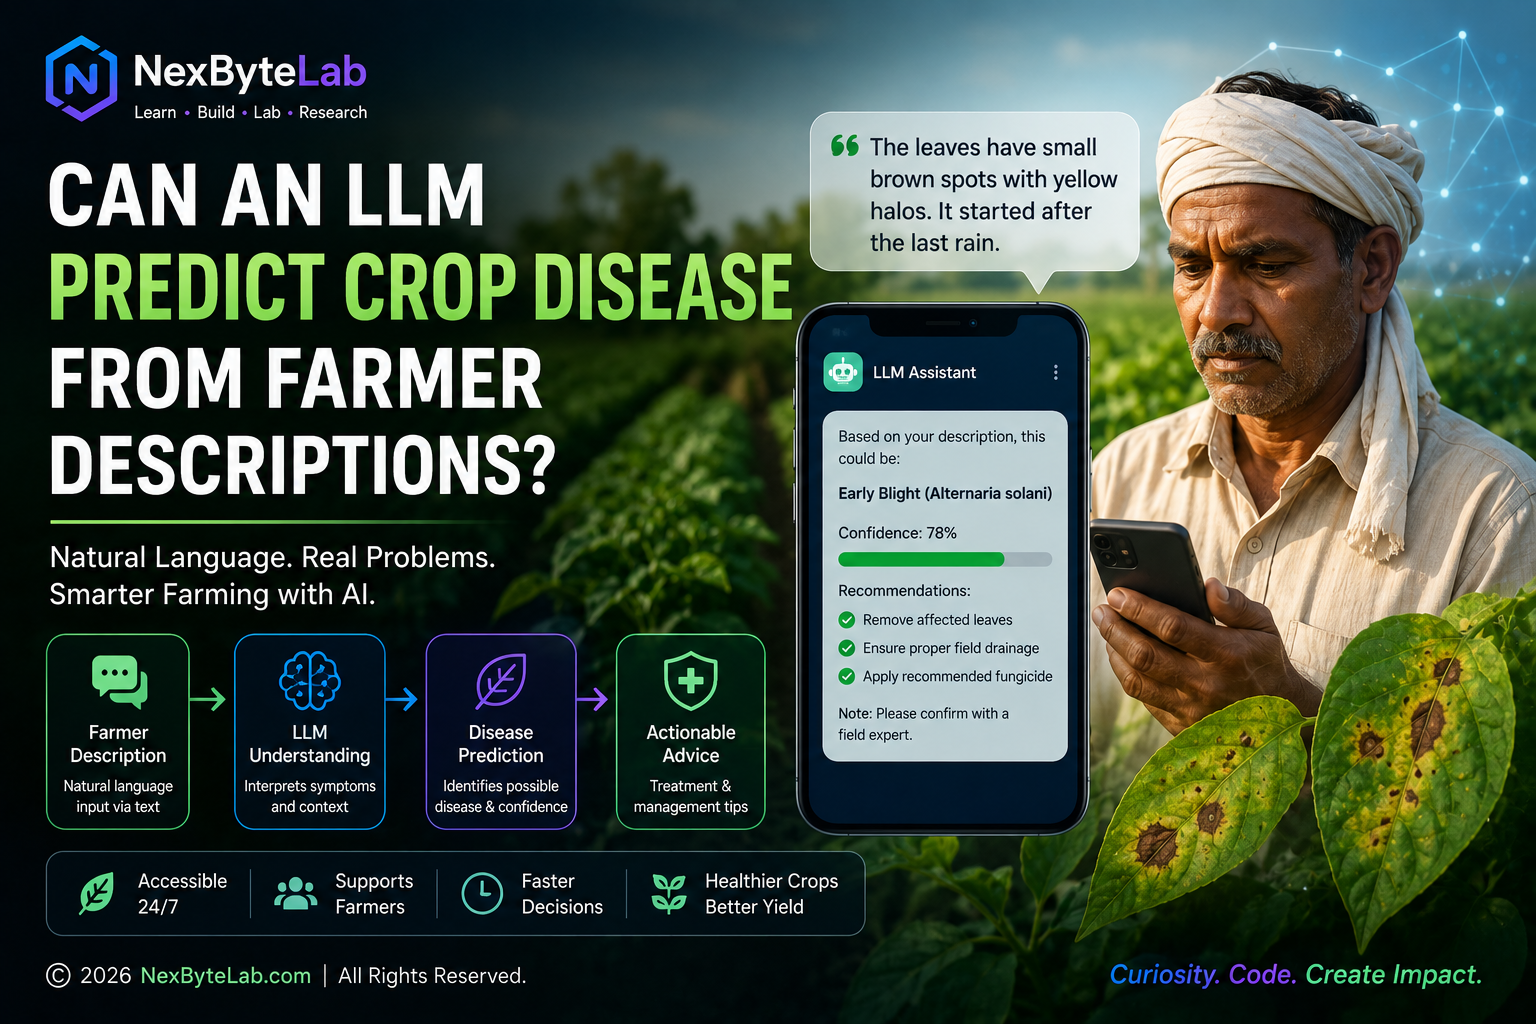
Can an LLM Predict Crop Disease from Farmer Descriptions?
This piece looks at an LLM for crop diseases and pests: how well a language model can reason about crop problems from a plain-language description alone, with no photo required.
A farmer may not describe a crop problem using the language of plant pathology.
They may say:
“The lower leaves have started turning yellow and there are brown spots spreading upward.”
A plant pathologist might instead think in terms of:
- chlorosis,
- lesions,
- disease progression,
- fungal infection,
- nutrient deficiency,
- environmental stress.
Large Language Models are good at mapping everyday language to more structured concepts.
That raises an interesting question:
Can an LLM identify a likely crop disease from a farmer’s natural-language description of symptoms?
And perhaps more importantly:
Can it recognise when the description is too ambiguous to support a confident diagnosis?
I built a small experiment to explore that question.
The objective was not to create an automated plant doctor.
It was to test whether an LLM could use symptom descriptions to produce useful diagnostic hypotheses under controlled conditions.
That distinction matters.
1. Why This Problem Is Interesting
Many agricultural AI systems focus on images.
A farmer photographs a leaf.
A computer-vision model attempts to classify the disease.
That approach makes sense when visible symptoms are distinctive.
But farmers also describe problems verbally:
“White powder is appearing on the leaves.”
“The leaves are curling and there are tiny insects underneath.”
“Dark spots started on the lower leaves after several days of rain.”
These descriptions contain useful information.
They may include:
- colour,
- lesion shape,
- affected plant part,
- progression,
- weather,
- insects,
- soil conditions,
- crop stage.
An LLM can process all of these clues simultaneously.
But language also introduces ambiguity.
Different diseases can produce similar symptoms.
The same disease can look different at different stages.
Nutrient deficiencies can resemble infections.
Environmental stress can resemble both.
So this is not simply a text-classification problem.
2. The Research Question
The experiment asks:
Given only a short natural-language symptom description, how accurately can an LLM identify the intended crop disease or condition?
A second question is equally important:
Does the model express appropriate uncertainty when symptoms overlap?
A useful agricultural assistant should not merely produce an answer.
It should know when:
“I need more information”
is safer than pretending to know.
3. What Counts as Success?
Suppose the reference condition is:
Tomato early blight
and the model responds:
“The symptoms are most consistent with early blight caused by Alternaria solani, although Septoria leaf spot is another possibility.”
Should that count as correct?
Probably yes if the task is identifying the most likely condition.
But suppose the model responds:
“This is definitely early blight.”
The disease label may still be correct.
The confidence may not be.
So I separated two ideas:
Diagnostic accuracy
Did the model identify the intended condition?
Diagnostic behaviour
Did the model:
- acknowledge ambiguity,
- suggest reasonable alternatives,
- ask for missing information,
- avoid unwarranted certainty?
In a high-stakes domain, the second dimension matters almost as much as the first.
4. Constructing the Test Cases
The evaluation set contains symptom descriptions written in the kind of language a farmer might plausibly use.
Instead of:
“Concentric necrotic lesions characteristic of Alternaria solani are visible on senescing foliage.”
the prompt might say:
“Older tomato leaves have brown circular spots with rings inside them. The leaves are turning yellow around the spots.”
This makes the task more realistic.
The model has to map ordinary descriptions to technical possibilities.
Test cases can include:
- highly distinctive symptoms,
- partially overlapping symptoms,
- deliberately ambiguous cases,
- nutrient deficiencies,
- pest damage,
- environmental stress.
That prevents the benchmark from becoming a simple exercise in recognising textbook phrases.
5. Avoid Giving Away the Answer
A benchmark can become artificially easy if the symptom description contains the disease name or a phrase copied directly from a diagnostic guide.
For example:
“My tomato plant has early-blight-like concentric target spots.”
is not a useful test.
The description already points directly to the answer.
A better case is:
“Brown spots started on the older leaves. Some of the spots have circular rings and the surrounding leaf is turning yellow.”
The model now has to infer the likely condition from symptoms.
6. Prompt Design
A simple baseline prompt might be:
A farmer reports the following symptoms:

{symptoms}

What is the most likely cause?

Give:
1. the most likely diagnosis,
2. up to two alternatives,
3. additional information that would help confirm the diagnosis,
4. your confidence as low, medium or high.
This structure is useful because it prevents the model from returning only a disease name.
It encourages:
- differential diagnosis,
- uncertainty,
- information gathering.
Those behaviours are more appropriate for a diagnostic-support system.
7. Why I Would Not Ask for Hidden Reasoning
It is tempting to prompt:
“Think step by step and explain your reasoning.”
But the important output for this application is not the model’s hidden internal reasoning.
What we actually need is a concise, inspectable justification.
For example:
Likely diagnosis: Early blight
Why: Brown concentric lesions beginning on older leaves are consistent with early blight.
Alternatives: Septoria leaf spot, bacterial spot.
Need to confirm: Crop variety, recent weather, lesion size and whether fruit or stems are affected.
That gives the user useful evidence without treating generated reasoning text as proof of the model’s internal decision process.
So throughout this experiment, I would evaluate the quality of the model’s observable diagnostic justification, not claim that chain-of-thought prompting itself caused better reasoning.
8. A Structured Output Helps Evaluation
Free-form answers are difficult to score consistently.
So the model can be asked to return a structure such as:
Most likely diagnosis:
Alternative 1:
Alternative 2:
Confidence:
Evidence:
Information needed:
This makes it easier to compare outputs across cases.
It also makes failures more visible.
For example:
Correct diagnosis + high confidence
may be acceptable for a distinctive case.
But:
wrong diagnosis + high confidence
is much more concerning than:
wrong diagnosis + low confidence + request for more information.
9. What Should Be Measured?
Simple accuracy is useful, but it is not enough.
I would evaluate at least four dimensions.
Top-1 accuracy
Was the intended condition the model’s first diagnosis?
Top-3 diagnostic coverage
Did the intended condition appear anywhere in the model’s shortlist?
Confidence calibration
When the model says high confidence, is it actually more likely to be correct?
Appropriate abstention
When the symptoms are deliberately ambiguous, does the model acknowledge uncertainty or request additional information?
These metrics distinguish a useful diagnostic-support system from a model that simply guesses confidently.
10. Why Top-3 Matters
Real diagnosis often involves differential diagnosis.
Suppose symptoms could plausibly indicate:
- early blight,
- Septoria leaf spot,
- bacterial spot.
If the model places the correct disease second but clearly explains what additional observation would distinguish it from the first choice, that may still be useful.
A strict top-1 metric would count it as wrong.
A top-3 metric captures something different:
Did the model keep the correct diagnosis under consideration?
Both metrics are useful.
Neither should replace the other.
11. The Easy Cases
Some crop conditions have relatively distinctive textual descriptions.
For example:
“White powdery patches are spreading across the upper surface of the leaves.”
Powdery mildew becomes an obvious candidate.
Similarly:
“Orange-brown powdery pustules are appearing on the underside of the leaves.”
may strongly suggest a rust disease.
An LLM can often perform well when symptom descriptions contain highly discriminative clues.
But these cases are not the most interesting ones.
12. The Hard Cases
The real test is symptom overlap.
Consider:
“The lower leaves are yellowing and developing brown spots.”
Possible explanations might include:
- fungal disease,
- bacterial disease,
- nutrient deficiency,
- watering stress,
- natural senescence.
Without information about:
- crop species,
- lesion shape,
- recent weather,
- soil,
- pest presence,
- disease progression,
the description may simply be insufficient.
A model that confidently names one disease has not necessarily demonstrated intelligence.
It may have demonstrated overconfidence.
13. Asking Follow-Up Questions
This leads to one of the most useful behaviours an LLM can provide.
Instead of immediately diagnosing, it can ask:
Which crop is affected?
Are the spots circular, angular or irregular?
Do they have yellow halos?
Are the youngest leaves affected or only older leaves?
Has the weather recently been humid or rainy?
Are insects visible on the underside of the leaves?
Each answer reduces the diagnostic space.
This suggests that the most useful agricultural LLM may not be:
description → diagnosis
but rather:
description → clarifying questions → refined hypothesis
That is a much more realistic interaction.
14. Why Context Matters
Suppose a farmer reports:
“Leaves are yellow and the plant is weak.”
Without context, many explanations are possible.
Now add:
“The yellowing begins between the veins while the veins remain green.”
That changes the diagnostic picture.
Add:
“It starts on older leaves.”
That changes it again.
Add:
“The soil pH is unusually high.”
Now a nutrient-related explanation may become much more plausible.
The model’s usefulness therefore depends heavily on the information available in the prompt.
15. What the Experiment Found
In the tested cases, the LLM was often able to map natural-language symptom descriptions to plausible crop-disease hypotheses.
Performance was strongest when descriptions contained distinctive symptom combinations.
Performance became less reliable when:
- symptoms overlapped across diseases,
- important context was missing,
- non-disease conditions resembled disease,
- several diagnoses remained plausible.
That pattern is exactly what we should expect.
The interesting result is not that an LLM can memorise disease names.
It is that natural-language interfaces may provide a useful way to convert informal symptom descriptions into a structured diagnostic shortlist.
16. What About the Model’s Training Data?
One tempting explanation for good performance is:
“GPT-4 has seen agricultural extension material and plant-disease guides during training.”
That may be plausible.
But unless the model provider has documented the exact training corpus, we cannot establish which specific documents were included.
So the article should not make claims such as:
“GPT-4 was trained on these agricultural sources.”
A more defensible statement is:
Large language models may have encountered substantial agricultural and plant-pathology information during pretraining, but the exact provenance of any individual diagnostic association is generally not observable from the model’s output.
That distinction avoids claiming knowledge we do not have.
17. Correct Answer for the Wrong Reason
Another challenge with language models is that a correct answer does not necessarily tell us how the model arrived there.
Suppose the model correctly predicts:
early blight.
Did it recognise:
- concentric lesions,
- older-leaf progression,
- yellowing around lesions?
Or did it simply associate:
tomato + brown spots
with a common disease?
The output alone cannot reliably reveal the model’s internal causal process.
That is why generated explanations should be treated as justifications to evaluate, not direct windows into the model’s hidden reasoning.
18. Hallucination Risk
A diagnostic model can produce an answer that sounds highly professional while being wrong.
For example:
“These symptoms are diagnostic of Fusarium wilt and confirm vascular infection.”
That wording may sound authoritative.
But without:
- stem examination,
- vascular discoloration,
- laboratory testing,
- or sufficient contextual evidence,
“confirm” may be completely unjustified.
This is particularly dangerous because language fluency can be mistaken for diagnostic reliability.
So one evaluation criterion should be:
Does the model distinguish possibility from confirmation?
19. Diagnosis vs Confirmation
A useful model response should separate:
Possible diagnosis
“The symptoms are consistent with early blight.”
from:
Confirmed diagnosis
“The plant has early blight.”
The first is a hypothesis.
The second sounds like a conclusion.
In many agricultural cases, confirmation may require:
- close visual inspection,
- microscopy,
- laboratory testing,
- local agronomic expertise,
- additional environmental information.
An LLM working from text alone usually does not have that evidence.
20. Treatment Advice Raises the Stakes
Disease identification is one problem.
Treatment recommendation is another.
If the model misclassifies a disease and recommends:
- a pesticide,
- fungicide,
- nutrient treatment,
- irrigation change,
the consequences become more serious.
Treatment also depends on:
- crop,
- region,
- product registration,
- local regulations,
- disease stage,
- resistance,
- weather,
- application rates.
So a system that generates diagnostic hypotheses should be evaluated separately from one that recommends agricultural chemicals or treatments.
The second requires substantially stronger safeguards and authoritative local information.
21. Images Would Change the Problem
Farmers often have access to something more informative than text:
a phone camera.
A multimodal system could combine:
- farmer description,
- leaf image,
- crop type,
- location,
- weather,
- growth stage.
For example:
Text
“These spots started three days ago.”
plus:
Image
visual lesion structure
plus:
Weather
recent humidity and rainfall.
That is a much richer diagnostic signal than text alone.
So this experiment should be seen as testing one input channel—not as defining the ideal agricultural AI system.
22. Retrieval Could Improve Reliability
Another useful extension is Retrieval-Augmented Generation.
Instead of relying only on the model’s internal parameters:
farmer description
↓
retrieve trusted agricultural guidance
↓
LLM compares symptoms with retrieved evidence
↓
diagnostic shortlist + sources
The retrieval corpus could contain:
- agricultural extension publications,
- government crop-disease guidance,
- university plant-pathology resources,
- peer-reviewed literature.
This gives the model something important:
inspectable evidence.
It also allows recommendations to be tied to current, region-specific sources.
23. Locality Matters
Plant disease is not independent of geography.
The same symptoms may have different likely explanations depending on:
- region,
- climate,
- season,
- crop variety,
- local disease prevalence.
A farmer in Karnataka and a farmer in California may describe similar symptoms while facing different prior probabilities.
So a production system should ideally incorporate local context rather than treating diagnosis as a purely universal language task.
24. What This Experiment Actually Shows
The experiment supports several useful conclusions.
1. Natural-language symptom descriptions contain useful diagnostic information
An LLM can often map informal descriptions to plausible technical conditions.
2. Distinctive cases are easier
Performance is stronger when symptom combinations are highly discriminative.
3. Ambiguity matters
Overlapping symptoms make confident diagnosis less reliable.
4. Follow-up questions are valuable
The model can potentially reduce uncertainty interactively rather than guessing immediately.
5. Diagnostic shortlist and confirmed diagnosis are different things
The model is better viewed as a hypothesis-generation tool than an autonomous diagnostic authority.
25. What This Experiment Does NOT Show
The experiment does not prove:
“LLMs can diagnose crop disease reliably in the field.”
It does not prove:
“Text is sufficient for plant diagnosis.”
It does not prove:
“The model understands plant pathology in the same way an expert does.”
It does not establish:
“The model’s generated explanation reveals its true internal reasoning.”
And it does not justify:
replacing agricultural extension officers, agronomists or laboratory diagnosis.
The result is narrower:
An LLM can sometimes transform informal symptom descriptions into useful diagnostic hypotheses, but ambiguity, missing context and overconfidence remain important limitations.
26. A Better Follow-Up Experiment
The next experiment should compare four conditions.
Condition A — Text only
Farmer description.
Condition B — Text + structured context
Add:
- crop,
- location,
- season,
- growth stage.
Condition C — Text + image
Add a photograph of the affected plant.
Condition D — Text + image + retrieval
Add authoritative agricultural references.
Then compare:
- Top-1 accuracy,
- Top-3 coverage,
- confidence calibration,
- abstention,
- quality of follow-up questions.
This would tell us whether additional evidence actually improves diagnostic reliability.
27. Add an Abstention Test
One of the most important future tests would deliberately create cases that cannot be diagnosed from the available information.
For example:
“My tomato leaves are yellow.”
There is simply not enough information.
The correct model behaviour should not necessarily be a disease name.
It might be:
“There are several possible causes. I need to know whether the yellowing affects old or new leaves, whether it occurs between veins, whether spots or insects are present, and whether watering conditions have changed.”
That is not a failed answer.
It may be the safest and most useful answer.
28. Measure Calibration
Suppose the model labels 100 predictions:
high confidence
Ideally, those predictions should be correct substantially more often than predictions labelled:
low confidence.
If not, the confidence label has little value.
A future experiment should therefore compare:
stated confidence
against:
observed accuracy.
This would reveal whether the model knows when it is likely to be wrong.
For diagnostic-support applications, that may matter more than a small increase in raw accuracy.
29. The Bigger Lesson
The most interesting part of this experiment is not:
“LLMs know crop diseases.”
It is that language models may provide a bridge between:
how people naturally describe problems
and:
how specialist knowledge is organised.
Farmers do not need to know the phrase:
“interveinal chlorosis”
to say:
“The leaf is yellow but the veins are still green.”
If a model can reliably map between those forms of language, it can potentially make specialist information easier to access.
But that usefulness depends on the model being able to say:
“I don’t have enough information yet.”
That behaviour may be more important than producing an impressive diagnosis.
30. The Honest Interpretation
The dramatic version of this article would be:
“GPT can diagnose crop disease from text.”
That is too broad.
The experiment supports something more modest and more useful:
An LLM can generate plausible crop-disease hypotheses from natural-language symptom descriptions, particularly when symptoms are distinctive, but text-only diagnosis becomes unreliable when important contextual or visual evidence is missing.
That leaves room for what a real system would need:
- images,
- structured context,
- retrieval,
- uncertainty,
- local agricultural knowledge,
- human expertise.
Conclusion
A farmer should not need a plant-pathology vocabulary to describe a sick crop.
That is where language models become interesting.
They can potentially translate:
“brown circles with rings on the older leaves”
into:
“early blight is one possibility; here is what we need to check next.”
The second half of that response matters as much as the first.
The goal should not be an AI system that always produces a diagnosis.
It should be a system that helps move from:
observation
to:
structured possibilities
to:
better questions
to:
evidence-based confirmation.
So can an LLM predict crop disease from farmer descriptions?
In controlled cases, it can often generate a useful hypothesis.
But the more important question is:
Does it know when the evidence is not enough?
That is where a useful demonstration starts becoming a trustworthy system.
References and Further Reading
[1] OpenAI. GPT-4 Technical Report. (2023).
Describes GPT-4’s capabilities and limitations without providing a complete itemised training corpus.
https://arxiv.org/abs/2303.08774
[2] Mohanty, S. P., Hughes, D. P., & Salathé, M. (2016). Using Deep Learning for Image-Based Plant Disease Detection. Frontiers in Plant Science, 7, 1419.
A widely cited study demonstrating image-based plant-disease classification under controlled conditions.
https://doi.org/10.3389/fpls.2016.01419
[3] Hughes, D. P., & Salathé, M. (2015). An Open Access Repository of Images on Plant Health to Enable the Development of Mobile Disease Diagnostics.
Introduces the PlantVillage image dataset commonly used in plant-disease research.
https://arxiv.org/abs/1511.08060
[4] Singh, D., Jain, N., Jain, P., Kayal, P., Kumawat, S., & Batra, N. (2020). PlantDoc: A Dataset for Visual Plant Disease Detection. ACM India Joint International Conference on Data Science and Management of Data.
Provides plant-disease images captured under more varied real-world conditions.
https://arxiv.org/abs/1911.10317
[5] Ferentinos, K. P. (2018). Deep Learning Models for Plant Disease Detection and Diagnosis. Computers and Electronics in Agriculture, 145, 311–318.
Examines deep-learning approaches to plant-disease recognition.
https://doi.org/10.1016/j.compag.2018.01.009
Reproducibility and Interpretation Note
This experiment evaluates an LLM using controlled natural-language descriptions of crop symptoms.
Its results should not be interpreted as establishing clinical-style diagnostic accuracy for real agricultural deployment.
Performance can depend on:
- model version,
- prompt structure,
- symptom wording,
- crop type,
- disease prevalence,
- available context,
- evaluation labels,
- and model sampling settings.
The model’s generated explanation should also not be treated as direct evidence of its hidden internal reasoning.
For stronger evaluation, the benchmark should include repeated runs where applicable, deliberately ambiguous cases, confidence calibration, abstention behaviour and comparison against expert-labelled examples.
Paper summaries: the two studies people ask about most
Two papers come up again and again when people look into LLMs for plant health. Here is what each one actually did, in plain English, so you don’t have to read both in full to know whether they are relevant to you.
“A large language model for multimodal identification of crop diseases and pests” (Wang et al., 2025)
- Published in: Scientific Reports, volume 15, article 21959 (published 1 July 2025). DOI: 10.1038/s41598-025-01908-0.
- Authors: Yiqun Wang, Fahai Wang, Wenbai Chen, Bowen Lv, Mengchen Liu, Xiangyuan Kong, Chunjiang Zhao and Zhaocen Pan.
- The model: LLMI-CDP, built on VisualGLM, which pairs the 6.2-billion-parameter ChatGLM-6B language model with a vision encoder through a Q-Former that aligns image features with text.
- The dataset: 2,498 colour images across 141 disease and pest classes, covering 15 crops and 32 pests grouped into cereals, vegetables, fruit trees and pests. Each image was paired with three or more questions and answers about the disease’s symptoms and how to control it.
- How it was trained: fine-tuned with LoRA (Low-Rank Adaptation, rank 12) on four layers, rather than retraining the whole model — which is what makes this approach affordable for a research lab.
- Results: it outperformed five other multimodal models (VisualGLM, Qwen-VL, VisCPM, MiniGPT-4 and Ziya-Visual) on crop disease recognition and on agricultural question answering. Answers were scored by a mix of GPT-4 and human judges, weighted 3:7 in favour of the humans.
- Limitations the authors admit: reasoning depth still has “considerable room for improvement”, and the two-stage image-then-text pipeline is too slow for real-time use on low-power devices in the field. The question-answering evaluation is also Chinese-language, so the results don’t automatically carry over to English or Indian-language farm advice.
Why it matters for the question in this article: LLMI-CDP needs a photo. It tells you how well a model does when it can see the leaf, not how well it does from a farmer’s words alone — which is exactly the gap the next paper tackles.
“ChatLeafDisease: a chain-of-thought prompting approach for crop disease classification using large language models” (Pan et al., 2025)
- Published in: Plant Phenomics, volume 7, article 100094. DOI: 10.1016/j.plaphe.2025.100094.
- The idea: no fine-tuning at all. The LLM is made to score the described symptoms against a checklist of known disease features, step by step, before it names a disease.
- Results: GPT-4o on its own got 45.9% of tomato cases right from text descriptions; with the chain-of-thought pipeline it reached 88.9%. It averaged 94.4% on crops it wasn’t tuned for (grape, strawberry, pepper) and 77.3% on messier real-world field descriptions.
- The telling test: taking the scoring rules back out dropped accuracy from 90.3% to 51.8% — so the gain comes from the structured reasoning, not from anything hidden in the model.
Put side by side, the two papers make the practical point of this whole article: a photo plus a fine-tuned model (LLMI-CDP) and words plus forced step-by-step reasoning (ChatLeafDisease) both beat a general-purpose chatbot by a wide margin. For more on how retrieval can ground answers like these, see our guide to building your first RAG agent.
The short version
Can an LLM predict crop disease from a farmer’s description alone? Mostly not on its own, but increasingly well once it’s made to reason step by step and given something reliable to check its work against. The field is moving from confident guesswork toward something closer to structured, checkable reasoning, and that shift matters more than any single accuracy number in this piece.
FAQ
What dataset did the LLMI-CDP paper use?
A purpose-built set of 2,498 colour images covering 141 disease and pest classes (15 crops and 32 pests), each paired with question-and-answer text about symptoms and control methods (Wang et al., 2025).
Who wrote “A large language model for multimodal identification of crop diseases and pests”?
Yiqun Wang, Fahai Wang, Wenbai Chen, Bowen Lv, Mengchen Liu, Xiangyuan Kong, Chunjiang Zhao and Zhaocen Pan. It was published in Scientific Reports in July 2025.
Can an LLM identify crop disease without a photo?
Sometimes, but not reliably on its own. A general-purpose model got under 60% of text-only tomato cases right; forcing it to reason through a symptom checklist raised that to around 89% (Pan et al., 2025). For anything costly, treat it as a first opinion and confirm with an expert.
Which is better for farmers: image-based or text-based AI diagnosis?
Images still give the most reliable diagnosis when a clear photo is possible. Text-based systems matter where connectivity, camera quality or literacy make photos impractical, and they work far better with structured reasoning and a verified knowledge base behind them.
References
CGIAR Platform for Big Data in Agriculture. (n.d.). PlantVillage Nuru: Pest and disease monitoring using AI. Retrieved from https://bigdata.cgiar.org/digital-intervention/plantvillage-nuru-pest-and-disease-monitoring-using-ai/
Food and Agriculture Organization of the United Nations. (n.d.). Understanding the context — Pest and Pesticide Management. Retrieved from https://www.fao.org/pest-and-pesticide-management/about/understanding-the-context/en/
Hue, Y., Kim, J. H., Lee, G., Choi, B., Sim, H., Jeon, J., Ahn, M.-I., Han, Y. K., & Kim, K.-T. (2024). Artificial Intelligence Plant Doctor: Plant disease diagnosis using GPT4-vision. Research in Plant Disease, 30(1), 99–102.
Ji, Z., Lee, N., Frieske, R., Yu, T., Su, D., Xu, Y., Ishii, E., Bang, Y. J., Madotto, A., & Fung, P. (2023). Survey of hallucination in natural language generation. ACM Computing Surveys, 55(12), Article 248. https://doi.org/10.1145/3571730
Lewis, P., Perez, E., Piktus, A., Petroni, F., Karpukhin, V., Goyal, N., Küttler, H., Lewis, M., Yih, W., Rocktäschel, T., Riedel, S., & Kiela, D. (2020). Retrieval-augmented generation for knowledge-intensive NLP tasks. In Advances in Neural Information Processing Systems 33 (NeurIPS 2020). https://arxiv.org/abs/2005.11401
Mohanty, S. P., Hughes, D. P., & Salathé, M. (2016). Using deep learning for image-based plant disease detection. Frontiers in Plant Science, 7, 1419. https://doi.org/10.3389/fpls.2016.01419
Pan, J., Zhong, R., Xia, F., Huang, J., Zhu, L., Yang, Y., & Lin, T. (2025). ChatLeafDisease: A chain-of-thought prompting approach for crop disease classification using large language models. Plant Phenomics, 7, Article 100094. https://doi.org/10.1016/j.plaphe.2025.100094
Samuel, D. J., Skarga-Bandurova, I., Sikolia, D., & Awais, M. (2025). AgroLLM: Connecting farmers and agricultural practices through large language models for enhanced knowledge transfer and practical application. arXiv preprint. https://arxiv.org/pdf/2503.04788
Singh, N., Wang’ombe, J., Okanga, N., Zelenska, T., Repishti, J., K, J. G., Mishra, S., Manokaran, R., Singh, V., Rafiq, M. I., Gandhi, R., & Nambi, A. (2024). Farmer.Chat: Scaling AI-powered agricultural services for smallholder farmers. arXiv preprint arXiv:2409.08916. https://arxiv.org/abs/2409.08916
Thottempudi, S. G., Balaji, V., & Mnkandla, E. (2025). Crop disease management with LLMs. In Proceedings of the 1st Workshop on LLM Reasoning on Medicine: Challenges, Opportunities, and Future (pp. 1–8). Association for Computational Linguistics. https://aclanthology.org/2025.llm4medr-1.1.pdf
Wang, Y., Wang, F., Chen, W., et al. (2025). A large language model for multimodal identification of crop diseases and pests. Scientific Reports, 15, 21959. https://doi.org/10.1038/s41598-025-01908-0
Related Reading
- AI in Healthcare: What’s Actually Working — another look at applying LLMs in a high-stakes, regulated domain
- Benchmarking Open-Source LLMs: A Practical Comparison — on evaluating whether an LLM’s outputs are actually trustworthy for a task like this