Getting Started with Statistics for Machine Learning: What You Actually Need to Know
This primer on statistics for machine learning beginners covers the handful of ideas — distributions, bias-variance, p-values, and data leakage — that actually show up in day-to-day ML work.
This is a practical primer on statistics for machine learning — the concepts that actually matter, without a full semester of theory.
Machine learning is often introduced through algorithms.
Linear regression. Decision trees. Random forests. Neural networks. Transformers.
But underneath almost every machine-learning experiment lies something more fundamental:
statistics.
Statistics helps us answer questions that an accuracy score alone cannot.
(For visual intuition alongside this article, Brown University’s Seeing Theory is an excellent free, interactive companion.)
Is the pattern in our data genuine or accidental?
Will the model work on people or situations it has never seen before?
Is a 1% improvement meaningful?
Is the model learning the phenomenon we care about—or exploiting an accidental correlation?
You do not need a degree in statistics to begin machine learning. But you do need enough statistical thinking to distinguish a model that produced a number from an experiment that produced evidence.
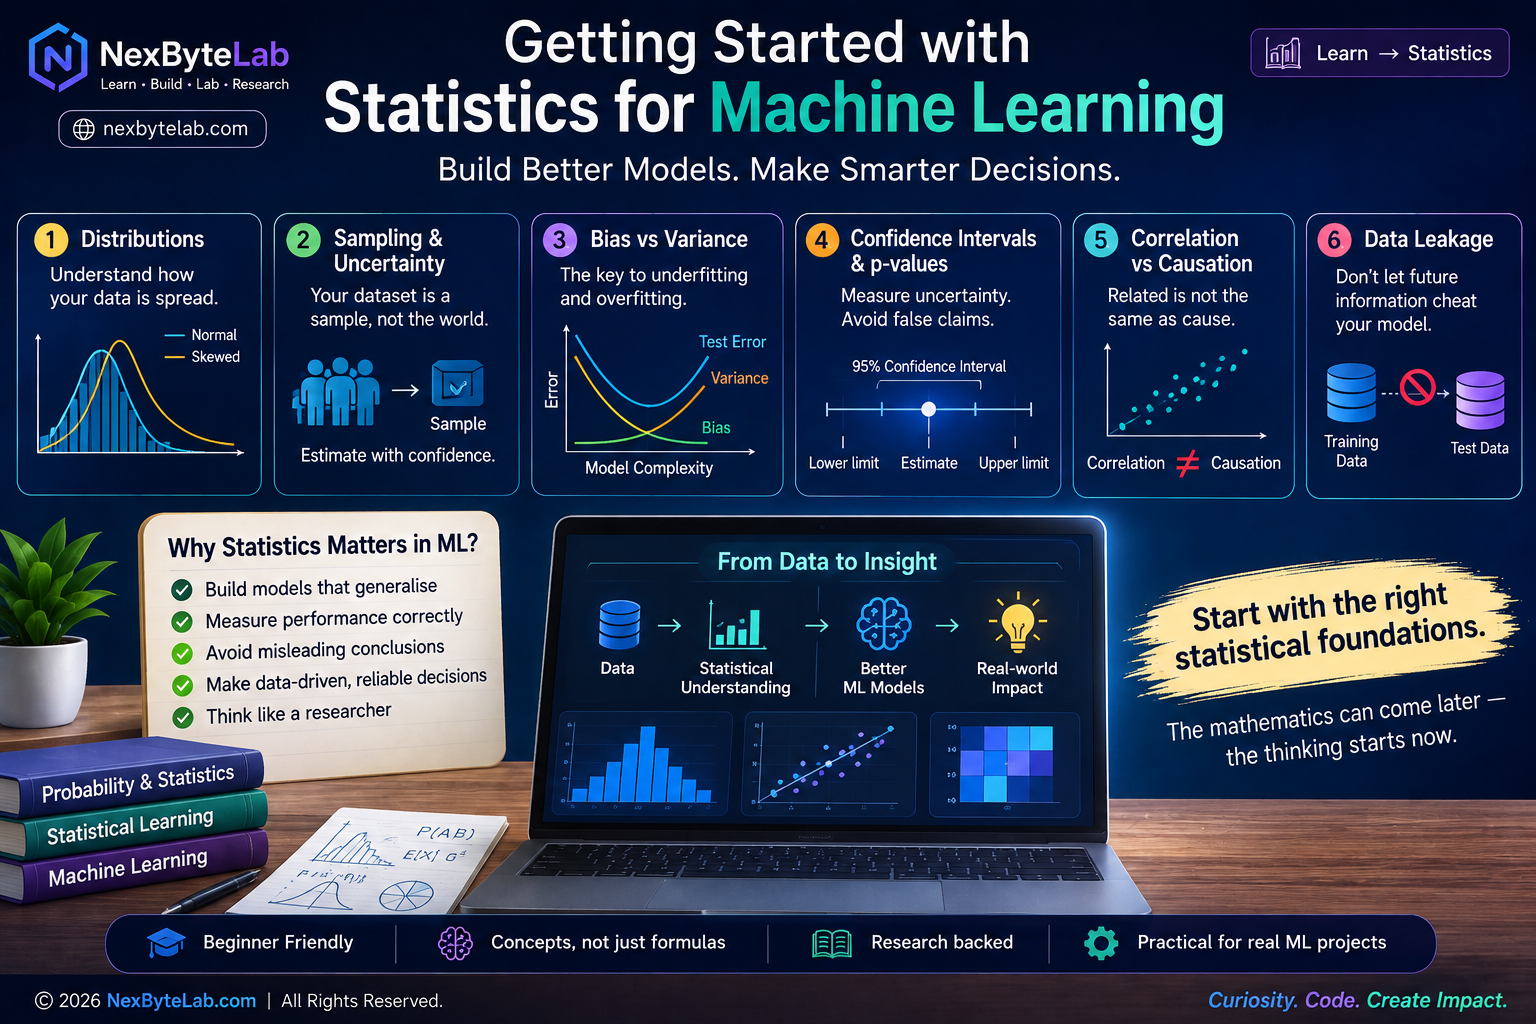
This research brief introduces six ideas worth understanding first:
- distributions,
- sampling and uncertainty,
- bias and variance,
- confidence intervals and p-values,
- correlation versus causation,
- and data leakage.
The mathematics can come later. First, we need the intuition.
1. Start With a Different Question
Suppose we build a machine-learning model that predicts whether a customer will leave a company.
The model reports:
Accuracy = 92%
That sounds impressive.
But statistics immediately asks us to slow down.
What percentage of customers actually leave?
How many observations were used?
Was the test data genuinely independent of the training data?
Would we obtain 92% again with another sample?
Are some customer groups poorly represented?
Could a simple baseline achieve nearly the same result?
These are statistical questions rather than programming questions.
And they illustrate why statistics matters to machine learning.
The goal is not merely to fit the data we already possess.
The goal is usually to learn something that generalises beyond those observations.
James, Witten, Hastie, Tibshirani and Taylor describe statistical learning as a collection of approaches for understanding relationships in data, including both prediction and inference [1]. Their treatment also makes a fundamental distinction between training performance and performance on previously unseen observations.
That distinction is the foundation of this article.
2. Distributions: What Does Your Data Actually Look Like?
Imagine measuring the height of 10,000 adults.
Most observations may cluster somewhere around the centre, with progressively fewer people at the extremes.
The resulting shape might resemble the familiar bell curve associated with a normal distribution.
But now consider household income.
A relatively small number of very high-income observations can create a long right-hand tail.
Or consider the number of purchases made by customers.
Many customers might buy nothing, while a smaller group buys repeatedly.
These variables clearly do not have the same statistical shape.
That shape is what we mean when discussing a distribution.
A distribution describes how the possible values of a variable are spread and how frequently different values occur.
MIT’s introductory probability and statistics curriculum explicitly includes probability distributions and asks students to learn how to work with and interpret different distributions rather than treating the normal distribution as universal.
Why does this matter for machine learning?
Because the distribution tells us something about the world from which our model is learning.
Suppose most salaries in a dataset fall between ₹30,000 and ₹100,000 per month, but a handful exceed ₹10 lakh.
The mean could be pulled upward by those extreme values.
The median may tell a different story.
Similarly, unusual values could be:
- genuine rare observations,
- measurement errors,
- data-entry mistakes,
- or important signals.
Blindly removing them as “outliers” may destroy useful information.
The practical lesson
Before building a sophisticated model, perform one of the simplest acts in data science:
look at your data.
Plot histograms. Examine ranges. Compare means and medians. Look for skewness, clusters, gaps and extreme observations.
A surprisingly large number of modelling problems become visible before the first algorithm is trained.
3. Sampling: Your Dataset Is Not the World
This is perhaps the most important statistical idea for a beginner.
A dataset is usually a sample.
The real population we care about is larger.
Suppose we want to build an agricultural model for farmers across India.
We collect data from 20,000 farms.
Twenty thousand observations sounds substantial.
But imagine that 90% of those observations came from only two states.
We have a large dataset.
We do not necessarily have a representative dataset.
This distinction matters because machine-learning models learn patterns from the data they receive, not from the population we wish we had sampled.
A simple analogy
Imagine tasting one spoonful of soup.
If the soup has been mixed properly, that spoonful may tell you a great deal about the whole pot.
If all the salt is sitting at the bottom, it may tell you very little.
Sampling works similarly.
The question is not simply:
How much data do we have?
It is also:
How was that data generated and what population does it represent?
MIT’s introductory computational data-science material treats sampling, standard error and confidence intervals as foundational concepts before moving into machine learning.
That ordering is worth noticing.
4. Mean, Variance and Standard Deviation: Three Numbers Worth Knowing
Suppose two classes take the same examination.
Both have an average score of:
70
Class A:
68, 69, 70, 71, 72
Class B:
40, 55, 70, 85, 100
The average is identical.
But the classes clearly behaved differently.
This is why averages alone are insufficient.
Mean
The mean tells us where the numerical centre lies.
Variance
The variance describes how widely observations are dispersed around the mean.
Standard deviation
The standard deviation expresses that spread in the original units of measurement.
For machine learning, variability matters enormously.
Two models may have the same average accuracy across experiments while one produces highly stable results and the other fluctuates substantially depending on the training sample.
Knowing the average without knowing the variability gives us only part of the picture.
5. Bias and Variance: Why Models Underfit and Overfit
Now we reach one of the most useful ideas in machine learning.
Imagine trying to predict house prices.
A very simple model may fail to capture important relationships in the data.
This is commonly associated with underfitting.
At the other extreme, an extremely flexible model might fit the training observations almost perfectly—including accidental noise.
It then performs poorly on new houses.
This is overfitting.
The underlying statistical framework is the bias–variance trade-off.
High bias
The model is too restrictive to capture important structure.
Think:
“My explanation of the world is too simple.”
High variance
The model reacts too strongly to the particular training sample.
Think:
“I learned this dataset rather than the broader pattern.”
An Introduction to Statistical Learning describes this trade-off as one of the central recurring ideas in statistical learning: good test performance generally requires managing both bias and variance.
A useful conceptual picture is:
Model too simple
High bias → Underfitting
↓
Useful complexity
Balance between bias and variance
↓
Model too flexible
High variance → Overfitting
But there is an important subtlety.
A more complicated model is not automatically better.
If the true relationship is relatively simple, a simpler model can generalise extremely well. Greater flexibility can reduce bias while simultaneously increasing variance.
That is one reason machine learning requires validation rather than simply choosing the most sophisticated algorithm available.
6. Training Accuracy Is Not the Same as Knowledge
Suppose we obtain:
Training accuracy: 99%
Is the model excellent?
We still don’t know.
Now suppose:
Test accuracy: 62%
The story changes completely.
The model has performed extremely well on observations it has already encountered but poorly on unseen data.
This is why machine learning separates data into training and evaluation sets and often uses cross-validation to estimate how a model may perform outside a particular training sample.
Statistical-learning literature treats cross-validation as a method for estimating test error when the true future test population is unavailable.
This leads to an important principle:
The purpose of machine learning is usually not to explain the training data perfectly. It is to generalise to data the model has not seen.
7. Confidence Intervals: One Number Is Rarely the Whole Story
Suppose Model A achieves:
Accuracy = 88.1%
and Model B achieves:
Accuracy = 88.7%
Can we conclude that Model B is superior?
Not yet.
If we repeat the experiment with another sample, another random seed or another train-test split, the numbers may change.
Statistics gives us tools for expressing this uncertainty.
One of them is the confidence interval.
Instead of reporting only:
Accuracy = 88.7%
an appropriately designed analysis may estimate an interval around a performance measure.
The exact interpretation and method depend on how the experiment was conducted, but the broader lesson is simple:
An estimate without uncertainty can create a false impression of precision.
MIT statistics coursework explicitly includes confidence intervals, bootstrap confidence intervals and hypothesis testing as core topics in applied statistical analysis.
Machine-learning research uses related tools because model evaluation itself contains uncertainty.
A study of machine-learning performance estimation, for example, demonstrated that estimated AUC and its uncertainty can vary substantially depending on the train/test sampling and validation procedure used.
8. P-Values: Useful, but Frequently Misunderstood
The p-value is one of the most misunderstood numbers in statistics.
A common incorrect interpretation is:
“p = 0.03 means there is a 97% probability that my hypothesis is correct.”
That is not what a p-value means.
In classical null-hypothesis significance testing, the p-value concerns how compatible the observed data—or something more extreme—would be with a specified null hypothesis and statistical model.
It does not directly tell us the probability that our scientific hypothesis is true.
MIT’s introductory probability and statistics curriculum includes null-hypothesis significance testing and computation and interpretation of p-values as part of statistical inference.
Why does this matter in machine learning?
Suppose two models differ by 0.4 percentage points.
We should not immediately write:
“Model B significantly outperforms Model A.”
We need an appropriate experimental design and statistical comparison.
And even statistical significance does not automatically imply practical significance.
A tiny improvement can be statistically detectable while being commercially or operationally irrelevant.
Conversely, an improvement that matters greatly in practice may be difficult to establish statistically if the sample is too small.
The question should therefore not merely be:
“Is p < 0.05?”
It should also be:
“How large is the effect, how uncertain is the estimate, and does the difference matter?”
9. Correlation Does Not Mean Causation
Suppose an e-commerce company discovers:
Customers using its mobile app spend more money.
Does the app cause people to spend more?
Possibly.
But perhaps highly engaged customers are simply more likely to install the app.
The variables are correlated.
The causal direction remains uncertain.
Correlation asks:
Do two variables move together?
Causation asks:
Does changing one variable produce a change in another?
These are very different questions.
Machine-learning models are particularly good at discovering predictive relationships.
But prediction alone does not establish causation.
A model may exploit relationships produced by:
- selection effects,
- confounding variables,
- measurement processes,
- historical practices,
- or accidental patterns.
That can still produce good predictive performance on similar data.
It does not mean the model has discovered the mechanism that created the outcome.
This becomes especially important when machine learning informs decisions in areas such as medicine, agriculture, public policy, hiring or education.
10. A Model Can Be Right for the Wrong Reason
Imagine training a system to recognise cows.
Nearly every photograph of a cow in the training set happens to contain green grass.
The model achieves excellent accuracy.
But what did it actually learn?
Cow?
or
Green pasture?
If the model later sees a cow standing on a road, performance may collapse.
This is an example of a broader problem:
spurious correlation.
Machine-learning algorithms optimise predictive objectives. They do not automatically distinguish a scientifically meaningful relationship from an accidental shortcut.
That is why understanding where the data came from is just as important as understanding the algorithm.
11. Data Leakage: When Your Model Accidentally Sees the Answer
One of the easiest ways to obtain spectacular machine-learning performance is also one of the worst:
accidentally allow information from the evaluation data to influence model training.
This is called data leakage.
Imagine predicting whether a patient will be admitted to hospital.
Your dataset contains a field that is generated only after admission.
The model may achieve extraordinary accuracy.
But it has effectively been given information from the future.
A subtler version occurs during preprocessing.
Suppose we normalise a dataset using statistics calculated from all observations before splitting into training and test sets.
Information from the test set has now influenced the training pipeline.
Even feature selection can create leakage if it is performed using the complete dataset before cross-validation.
The corrections published for An Introduction to Statistical Learning explicitly warn that model-selection steps must be performed separately within each training fold; otherwise cross-validation can severely underestimate test error.
This is an extremely important research lesson:
A model can produce an impressive result and still be scientifically invalid.
12. Statistics Changes How You Read Machine-Learning Results
Once you understand these ideas, your reaction to ML claims begins to change.
Instead of seeing:
“Our AI achieved 96% accuracy.”
and immediately being impressed, you start asking:
96% on what dataset?
How large was the test set?
Was it representative?
What was the baseline?
Was the test set truly unseen?
Was preprocessing performed inside the training pipeline?
How variable were the results across folds or repeated runs?
What metric was used?
What is the uncertainty around that estimate?
Could the model be exploiting a spurious correlation?
These questions are the beginning of research thinking.
13. What Should an ML Beginner Actually Learn?
You do not need to study all of mathematical statistics before training your first model.
A sensible progression is:
Level 1 — Understand your data
Mean → Median → Variance → Standard deviation → Histograms → Distributions → Outliers
↓
Level 2 — Understand relationships
Covariance → Correlation → Regression
↓
Level 3 — Understand uncertainty
Sampling → Standard error → Confidence intervals → Hypothesis testing → p-values
↓
Level 4 — Understand model behaviour
Training vs test error → Bias → Variance → Overfitting → Cross-validation
↓
Level 5 — Think like a researcher
Sampling bias → Data leakage → Confounding → Spurious correlations → Statistical vs practical significance → Reproducibility
This is enough statistical foundation to begin asking much better questions of machine-learning models.
The deeper mathematics can then be learned as the problems require it.
14. A Simple Statistical Checklist Before Training Any Model
Before opening your favourite ML library, ask:
What does each variable represent?
What does its distribution look like?
Are values missing?
Are extreme observations errors or genuine cases?
How was this sample collected?
Does it represent the population where the model will eventually operate?
Then, after training:
Did the model generalise beyond the training data?
How stable is the result?
What baseline am I comparing against?
Could there be leakage?
Is the relationship merely predictive, or am I accidentally making a causal claim?
Is the improvement large enough to matter?
These questions often contribute more to a reliable ML experiment than trying another ten algorithms.
The Bigger Lesson
Statistics is sometimes presented to machine-learning students as a collection of equations that must be learned before they are allowed to do the interesting work.
That misses the point.
Statistics is really a discipline for reasoning under uncertainty.
Machine learning gives us powerful tools for finding patterns.
Statistics helps us ask whether those patterns are reliable, whether they generalise, how uncertain our conclusions are, and whether our experiment actually supports the claim we want to make.
The two disciplines are therefore not competitors.
They answer complementary questions.
Machine learning asks:
Can we learn a useful pattern from the data?
Statistics asks:
How much confidence should we place in what we learned?
A good machine-learning practitioner needs both ways of thinking.
And that is why the best place to begin statistics for ML is not with hundreds of formulas.
It is with a handful of good questions.
Key Takeaways
Distribution tells you what your data looks like.
Sampling tells you how carefully you can generalise from it.
Variance and standard deviation tell you how much observations or estimates vary.
Bias and variance help explain underfitting and overfitting.
Confidence intervals help communicate uncertainty instead of presenting estimates as absolute truth.
P-values can contribute to statistical inference, but they are not probabilities that your hypothesis is correct.
Correlation can help prediction without proving causation.
Data leakage can make a poor experiment look like an excellent model.
Put together, these concepts teach perhaps the most valuable habit in machine learning:
Do not ask only whether the model works. Ask what evidence shows that it works, under what conditions, and how certain you are.
References and Further Reading
[1] James, G., Witten, D., Hastie, T., Tibshirani, R., & Taylor, J. An Introduction to Statistical Learning: With Applications in Python. Springer. The text provides an accessible treatment of statistical learning, including regression, classification, resampling, model selection, tree methods, support vector machines and deep learning.
[2] MIT OpenCourseWare. 18.05 Introduction to Probability and Statistics. The curriculum covers probability distributions, covariance and correlation, estimation, Bayesian inference, confidence/credible intervals and hypothesis testing.
[3] MIT OpenCourseWare. 6.0002 Introduction to Computational Thinking and Data Science. Relevant material includes stochastic thinking, Monte Carlo simulation, confidence intervals, sampling, standard error, experimental data and an introduction to machine learning.
[4] MIT OpenCourseWare. 18.443 Statistics for Applications. Course material includes distributions, maximum likelihood estimation, bootstrap confidence intervals, hypothesis testing, regression, ANOVA and categorical-data analysis.
[5] James, G., Witten, D., Hastie, T., & Tibshirani, R. An Introduction to Statistical Learning, bias–variance and cross-validation discussions. The text describes the bias–variance trade-off as a central theme in statistical learning and explains the role of cross-validation in estimating test error.
Next in the Statistics Series
Bias vs Variance: Why Machine-Learning Models Underfit and Overfit
Rather than treating bias and variance only as definitions, we can turn the next article into a visual experiment: generate the same dataset, fit models of increasing complexity, and watch training error, test error, bias and variance change.
That is where statistics stops being something we memorise and becomes something we can actually observe.
Related Reading
- Python for Data Science: The Essential Toolkit — the Python toolkit to apply these concepts
- Transformers Explained — Transformers, one of the architectures mentioned above
- How Much Real Data Stops Model Collapse? A Minimal Recursive-Training Simulation — a hands-on simulation of the variance and sampling-error concepts covered here
- Reproducing Double Descent: Why 300 Features Beat 39 on the Same 40 Data Points — a hands-on demonstration of how the bias-variance tradeoff breaks down near the interpolation threshold