
Z-Score Thresholds vs. Isolation Forest: What Each Catches in Expense Fraud
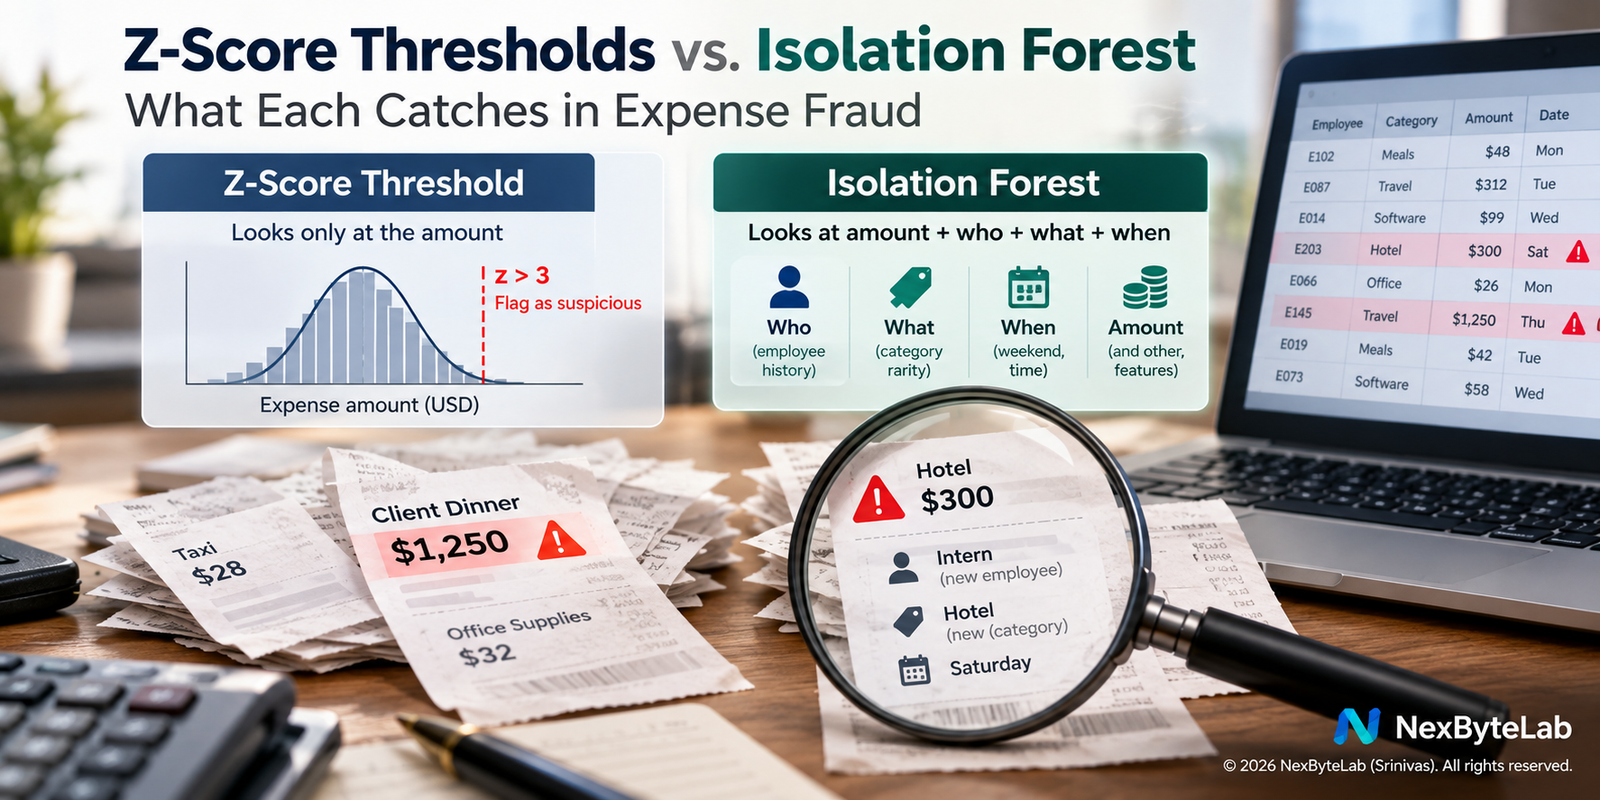
This isolation forest expense fraud detection experiment puts two detection methods head-to-head on the same synthetic dataset: a simple z-score threshold, and a multivariate isolation forest that factors in who is spending, on what, and when — to see exactly what each one catches, and what each one misses.
Concept
Most finance teams still flag suspicious expense claims with a simple rule: if an amount exceeds some dollar cap, or its z-score against the company-wide distribution crosses a threshold (say, 3 standard deviations), it gets reviewed. This is popular for a good reason — it’s cheap, auditable, and easy to explain to a compliance committee. It is also, by construction, blind to context. A $300 claim is not unusual for a company where typical claims run $50–$400. But it is very unusual if the person filing it is an intern who has never claimed more than $40, in a category they’ve never used, on a Saturday. None of that shows up in a single global amount threshold, because a threshold only ever looks at one number in isolation.
The Association of Certified Fraud Examiners’ 2026 Report to the Nations puts the median occupational fraud loss at $104,000 per case, with schemes running a median of 12 months before anyone catches them — and schemes that survive past five years cause losses over $1.1 million. Tips from coworkers remain the single most common way fraud is caught (43% of cases), which is itself a signal that automated detection is leaving a lot on the table. That raises an obvious, testable question: how much of that gap is because the detection method only looks at amount, and not at who is spending, on what, and when?
Hypothesis: at a matched alert budget (the same number of flagged transactions an investigator would actually review), a multivariate anomaly detector that includes employee-relative spending and category context will catch fraud cases that a raw-amount z-score threshold misses almost entirely, while matching the threshold rule on the fraud that is a pure dollar-amount outlier. This is falsifiable: if the multivariate model performs no better than the threshold on contextual cases, the hypothesis is wrong.
Experiment
I built a synthetic but structurally realistic expense dataset: 50 employees, each with their own baseline spend level and 1–2 “usual” categories, generating 2,900 ordinary transactions. Into that I injected two distinct kinds of anomalies, 100 in total (3.3% of the data):
- Spike (45 cases): a transaction that is 9–16x larger than what that employee/category combination normally costs — a raw dollar outlier, obvious from the amount alone.
- Contextual (55 cases): an amount that is completely unremarkable company-wide (it matches what plenty of other employees legitimately spend), but wrong for this employee — a category they’ve never filed under before, on a weekend.
I then scored every transaction two ways, at the same alert budget (100 flagged transactions, matching the true anomaly count, so precision and recall come out equal):
- Method A — global z-score rule: flag the 100 transactions with the highest z-score on raw dollar amount.
- Method B — Isolation Forest: flag the 100 highest-scoring transactions from an
IsolationForestfit on amount, the transaction’s z-score relative to that employee’s own history, how rare that category is for that employee, a weekend flag, and one-hot category.
Core logic (trimmed for length — full script generates the synthetic data, engineers features, and evaluates both methods):
emp_mean = df.groupby("employee")["amount"].transform("mean")
emp_std  = df.groupby("employee")["amount"].transform("std").replace(0, 1)
df["emp_rel_z"] = (df["amount"] - emp_mean) / emp_std          # employee-relative context
df["cat_rarity_for_emp"] = 1 - cat_freq_norm.lookup(df.employee, df.category)

# Method A: univariate threshold
df["global_z"] = (df["amount"] - df.amount.mean()) / df.amount.std()
rule_flagged = top_n(df["global_z"], n=budget)

# Method B: multivariate Isolation Forest
X = df[["amount", "emp_rel_z", "cat_rarity_for_emp", "weekend"]].join(category_dummies)
iso = IsolationForest(n_estimators=200, contamination=budget/len(df), random_state=42).fit(X)
iso_flagged = top_n(-iso.decision_function(X), n=budget)
Everything ran locally with scikit-learn, pandas, and numpy in under three seconds — no external data, no API calls.
Results
Both methods caught almost all the obvious spikes. The difference is entirely in the contextual anomalies — the ones that look normal until you know whose claim it is:
| Metric | Z-score rule (amount only) | Isolation Forest (multivariate) |
|---|---|---|
| Precision @ 100 alerts | 0.460 | 0.690 |
| Recall @ 100 alerts | 0.460 | 0.690 |
| ROC-AUC (overall) | 0.752 | 0.993 |
| Recall on spike cases (n=45) | 0.978 | 0.978 |
| Recall on contextual cases (n=55) | 0.036 | 0.455 |
The z-score rule caught 97.8% of the pure amount spikes but only 3.6% of the contextual anomalies — essentially random luck at that rate. The Isolation Forest matched it exactly on the spikes (97.8%) and caught 45.5% of the contextual cases: worse than a coin flip in absolute terms, but roughly 12.5x better than the threshold rule on that same subset. At the identical review workload (100 flagged transactions), that’s 69 true positives instead of 46 — a 50% increase in fraud actually surfaced to an investigator, for zero additional alerts. This is a small, synthetic, single-seed run, so treat the exact percentages as illustrative rather than universal; the qualitative gap between “sees only amount” and “sees amount plus context” is the reproducible part.
Explanation
This result is a clean illustration of the distinction anomaly-detection researchers draw between point anomalies (values that are extreme on their own) and contextual anomalies (values that are only extreme given surrounding conditions). A univariate threshold can only ever see point anomalies, no matter how you tune it — there is no threshold on amount alone that flags “$300, filed by an intern, in a category she’s never used, on a Saturday” without also flagging every legitimate $300 claim filed by everyone else. You need features that encode who and when, not just how much.
That gap shows up in the fraud-detection literature too. A 2025 review of machine-learning architectures for financial fraud detection notes plainly that “rule-based systems often struggle to identify novel fraud schemes and require continuous manual updates to remain effective,” and that such systems “often fail to identify sophisticated fraud schemes that deliberately mimic legitimate transaction patterns” — which is exactly what my contextual anomalies were built to do: mimic a legitimate amount while breaking the context around it (source in Resources below). A widely cited SAS Global Forum paper on Isolation Forest for fraud detection found a similar pattern on real transaction data (the PaySim dataset): a default Isolation Forest reached an AUC of 0.83, and after light tuning it surfaced up to 158 of the true fraud cases within the top 1,000 highest-risk transactions — well above what a single-feature score would find, though still far from complete detection, matching the “meaningfully better, not solved” result here.
It’s worth being honest about what this does not show. Industry commentary on AI-driven fraud detection in 2026 tends to claim faster detection and fewer false positives over legacy rules, but rarely backs that with numbers you can check. My own result is a caution against over-claiming in the other direction too: 45.5% recall on contextual fraud means more than half of the subtle cases were still missed by the multivariate model. Isolation Forest isn’t a solved-problem button; it’s a meaningfully better-informed detector that still needs a human in the loop, which lines up with the ACFE’s own finding that active detection controls reduce losses and detection time rather than eliminating fraud outright. It also echoes something we found testing whether an LLM could predict crop disease from a text description alone: applied AI models tend to look strong in aggregate while quietly failing hardest on exactly the minority-class cases you built them to catch in the first place.
The practical takeaway for anyone building or evaluating a fraud/anomaly system: don’t just report a single “accuracy” or “AUC” number. Break performance down by anomaly type, the way the recall-by-kind row in the results table does here — an aggregate ROC-AUC of 0.993 sounds close to perfect, and it would have hidden the fact that more than half of one entire category of fraud still gets through.
Resources
- ACFE — Occupational Fraud 2026: A Report to the Nations (key findings)
- Machine Learning Architectures for Financial Fraud Detection (GJETA, 2025)
- Detecting Fraud and Other Anomalies Using Isolation Forests (SAS Global Forum)
- AI Fraud Detection in 2026: What Security and Risk Leaders Must Know (Protegrity)
- scikit-learn: IsolationForest documentation
Related Reading
- AI in Healthcare: What’s Actually Working — another grounded, domain-specific look at where applied AI actually adds value versus where it’s overstated.
- Can an LLM Predict Crop Disease from Farmer Descriptions? — a sibling applied-AI experiment showing the same pattern of uneven performance on minority-class cases.
- Getting Started with Statistics for Machine Learning — the z-score and distributional assumptions this experiment’s baseline rule relies on, explained from first principles.