
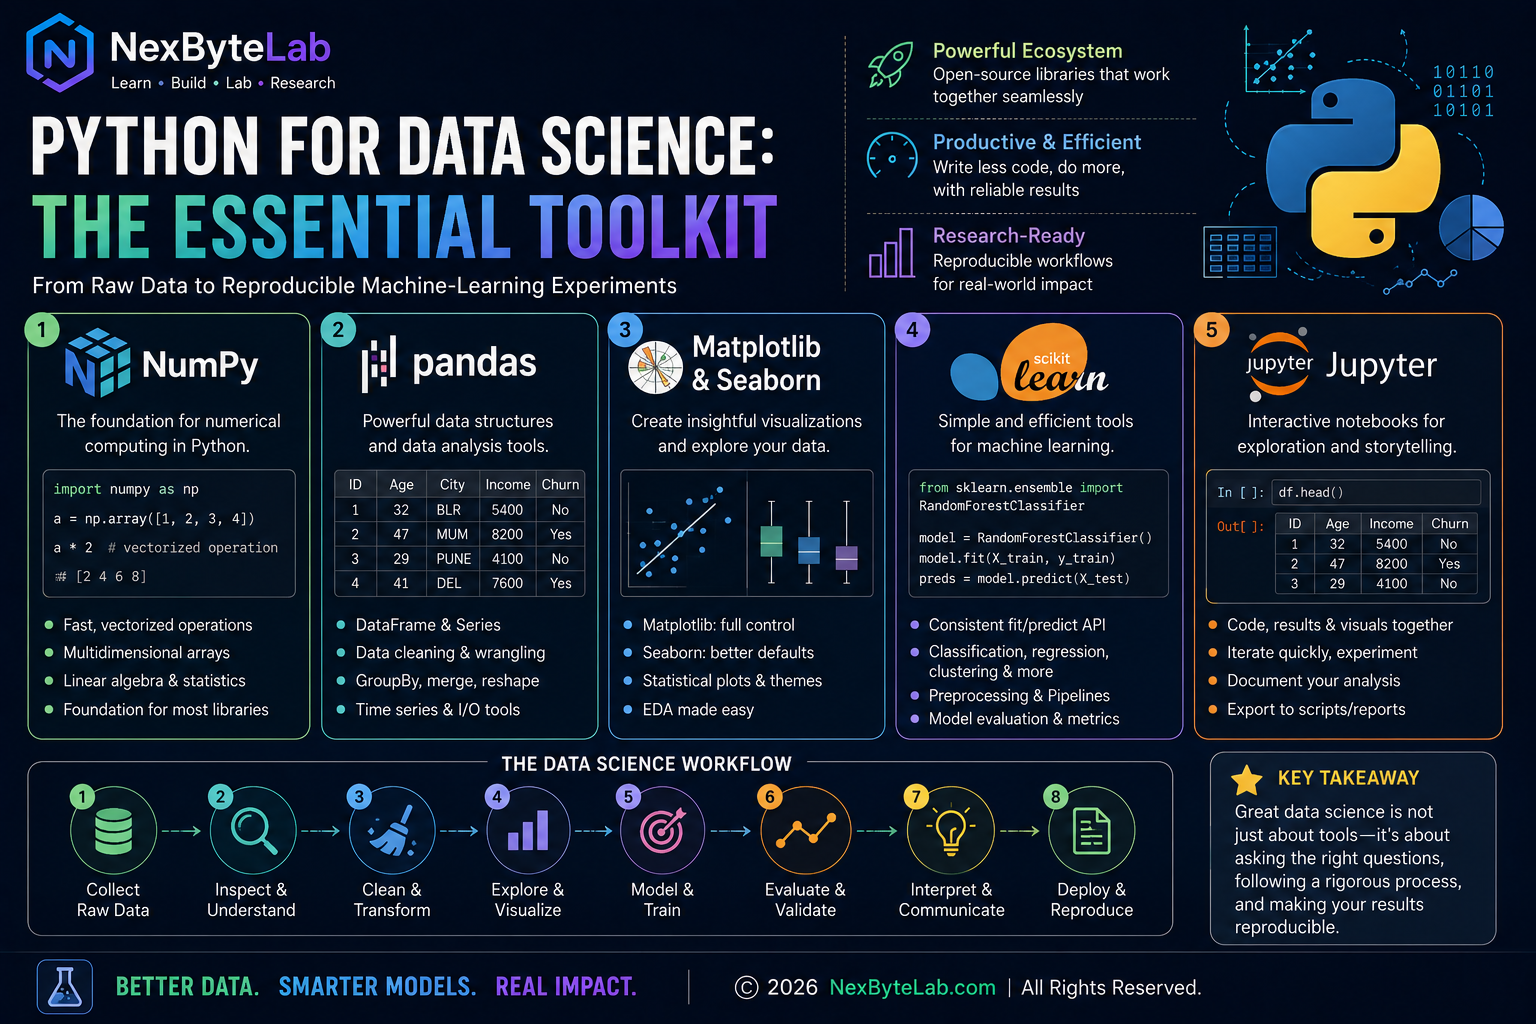
From Raw Data to Reproducible Machine-Learning Experiments
This guide covers the python data science essential toolkit end to end — the handful of libraries and habits that take you from a messy CSV to a reproducible machine-learning experiment.
Getting from a messy CSV to reproducible machine-learning experiments takes more than knowing an algorithm — it takes the right toolkit, used the right way.
If you are starting data science today, one of the first pieces of advice you will probably hear is:
Learn Python.
That advice is reasonable—but incomplete.
Python by itself does not perform data science.
Its real strength comes from an ecosystem of specialised libraries that work together: one handles numerical arrays, another organises tabular data, another creates visualisations, another provides machine-learning algorithms, and interactive environments help researchers explore ideas and document experiments.
For a beginner, however, that ecosystem can look overwhelming.
NumPy. pandas. Matplotlib. Seaborn. SciPy. scikit-learn. Jupyter. PyTorch. TensorFlow. Polars. Statsmodels.
Where do you begin?
You do not need to learn all of them.
For a strong first foundation, five parts of the ecosystem will take you surprisingly far:
NumPy → pandas → Matplotlib/Seaborn → scikit-learn → Jupyter
The important thing is not simply knowing their names.
It is understanding where each fits in the process of turning raw data into defensible evidence.
1. First, What Does a Data Scientist Actually Do?
Popular descriptions sometimes reduce data science to:
Data → Machine Learning → Prediction
Real work is rarely that clean.
Imagine that we want to predict whether a student is likely to complete an online course.
We receive a dataset containing:
- age,
- attendance,
- assignment scores,
- login frequency,
- course duration,
- previous qualifications,
- and whether the student completed the course.
Can we immediately train a machine-learning model?
Probably not.
We first need to ask:
Are values missing?
Are there duplicate records?
Are numerical fields stored as text?
Are some values impossible?
Is the target severely imbalanced?
Which variables appear related?
Could any feature accidentally reveal the outcome?
How should we divide the data into training and evaluation sets?
Only then does model training become meaningful.
A more realistic workflow looks like:
Raw data
↓
Inspect
↓
Clean
↓
Transform
↓
Explore
↓
Visualise
↓
Build model
↓
Evaluate
↓
Interpret
↓
Communicate
The Python data-science ecosystem exists largely to support these stages.
2. NumPy: The Numerical Foundation
Let us start underneath much of the scientific Python ecosystem.
NumPy—Numerical Python—provides efficient multidimensional arrays and operations on those arrays.
The importance of NumPy is difficult to overstate. A 2020 Nature paper describes NumPy as the primary array-programming library for Python and discusses its role as an interoperability layer across an increasingly specialised scientific-computing ecosystem.
But why do we need arrays?
Suppose we have five temperatures:
temperature = [28, 30, 31, 29, 32]A standard Python list can store them.
But data science often involves operations such as:
add 2 to every observation
calculate the mean
standardise every value
multiply matrices
perform linear algebra
apply a mathematical function to millions of values
NumPy is designed for precisely this style of computation.
3. The Key NumPy Idea: Think in Arrays, Not Loops
A beginner might write:
values = [10, 20, 30, 40]

result = []

for value in values:
    result.append(value * 2)
With NumPy:
import numpy as np

values = np.array([10, 20, 30, 40])

result = values * 2
The result is:
[20 40 60 80]The second version is not merely shorter syntax.
It represents a different way of thinking:
Operate on the collection as an array rather than manually visiting every element in Python code.
This is usually called vectorization.
NumPy’s underlying implementation allows many array operations to execute in optimized compiled code rather than through explicit Python-level loops. Its importance to scientific computing comes from both this computational model and the common array representation it provides to other libraries.
4. Why NumPy Matters to Machine Learning
Consider a dataset containing:
10,000 customers × 50 features
Mathematically, that can be represented as a matrix: X∈R10000×50
A machine-learning algorithm performs operations on these kinds of numerical structures.
Linear regression, principal component analysis, neural networks and many other methods ultimately rely heavily on:
- vectors,
- matrices,
- dot products,
- transformations,
- aggregations,
- and linear algebra.
You therefore do not need to become a NumPy expert before learning ML.
But you should become comfortable with:
arrays, shapes, dimensions, indexing, slicing, broadcasting, aggregation and vectorized operations.
These concepts reappear everywhere.
5. pandas: Turning Arrays Into Data
NumPy is excellent when we think mathematically.
But real-world data usually looks more like this:
| Customer | Age | City | Spend | Churn |
|---|---|---|---|---|
| A | 32 | Bengaluru | 5400 | No |
| B | 47 | Mumbai | 8200 | Yes |
| C | 29 | Pune | 4100 | No |
Now column names and row labels matter.
Different columns may also have different types.
This is where pandas becomes extremely useful.
Its central abstraction is the:
DataFrame
A DataFrame gives us a labelled, table-like structure for working with data.
When Wes McKinney introduced pandas in a 2010 scientific-computing paper, the motivation was explicitly practical: statistical datasets commonly arrive in tabular form, and researchers need useful data structures and tools for manipulating them before statistical modelling.
That problem remains fundamental.
6. Why Data Cleaning Usually Comes Before Machine Learning
Suppose we receive:
Age     Income     City
34      75000      Bengaluru
?       92000      Bangalore
41      NA         Mumbai
-5      68000      Pune
There are already questions.
What does ? mean?
What does NA mean?
Is -5 an error?
Are Bengaluru and Bangalore intended to represent the same category?
Machine learning does not magically resolve these issues.
If the input data is unreliable, the resulting model may simply learn patterns from unreliable data.
This is why a substantial part of applied data science happens before model.fit().
7. The pandas Skills Worth Learning First
You do not need to memorise the entire pandas API.
Start with a small set of operations.
Inspect
df.head()
df.info()
df.describe()
Select
df["income"]Filter
df[df["income"] > 50000]Handle missing data
df.isna()
df.dropna()
df.fillna()
Group
df.groupby("city")["income"].mean()Combine datasets
pd.merge(customers, orders, on="customer_id")Sort
df.sort_values("income")These operations cover a large amount of everyday exploratory data work.
But there is a deeper lesson:
Do not learn pandas as a list of commands. Learn it as a way to ask questions of tabular data.
8. Exploratory Data Analysis: Look Before You Model
Suppose a dataset contains house prices.
Before building a prediction model, we might ask:
What does the price distribution look like?
Are there extreme values?
How does price change with floor area?
Are some locations systematically more expensive?
Are any variables suspiciously correlated with the target?
This process is generally called Exploratory Data Analysis (EDA).
EDA is not just about making attractive charts.
It is about understanding what kind of problem you actually have.
That brings us to visualization.
9. Matplotlib: The Plotting Foundation
Matplotlib is one of Python’s foundational visualization libraries.
Its role is to provide flexible plotting infrastructure for creating scientific and analytical graphics. The SciPy ecosystem’s citation guidance identifies John Hunter’s 2007 paper Matplotlib: A 2D Graphics Environment as the canonical publication associated with the library.
A simple example:
import matplotlib.pyplot as plt

plt.hist(df["income"])
plt.xlabel("Income")
plt.ylabel("Frequency")
plt.show()
That small chart can reveal things that a spreadsheet column may hide:
- skewness,
- unusual peaks,
- extreme observations,
- gaps,
- or suspicious values.
Visualization therefore acts as a diagnostic tool.
10. Seaborn: Statistical Questions as Graphics
Matplotlib provides substantial control.
Seaborn provides a higher-level interface aimed specifically at statistical visualization.
Its published software paper describes Seaborn as a statistical graphics library built with a high-level, dataset-oriented interface, closely integrated with pandas and built on Matplotlib.
For example:
import seaborn as sns

sns.scatterplot(
    data=df,
    x="area",
    y="price"
)
or:
sns.boxplot(
    data=df,
    x="city",
    y="income"
)
These are not merely pictures.
They represent questions:
Does price increase with area?
Do income distributions differ by city?
Are there unusual observations?
Do categories behave differently?
This is the right way to think about data visualization.
11. Do Not Trust a Graph Just Because It Looks Good
Visualization introduces another research responsibility.
Graphs can mislead.
For example:
- truncated axes can exaggerate differences,
- inappropriate bin sizes can change the appearance of distributions,
- overlapping points can hide density,
- colour scales can distort interpretation,
- aggregation can conceal important subgroups.
Therefore a research-quality visualization should not ask only:
“Does this look attractive?”
It should ask:
“Does this representation faithfully communicate the data?”
That distinction separates visual decoration from analytical visualization.
12. scikit-learn: From Data to Machine Learning
Once the data is understood and prepared, we can begin modelling.
For classical machine learning, scikit-learn remains one of Python’s most important libraries.
The original JMLR paper describes it as integrating a wide range of machine-learning algorithms for medium-scale supervised and unsupervised problems, with emphasis on ease of use, performance, documentation and API consistency.
That API consistency is one of its greatest educational strengths.
Different algorithms often follow a similar pattern.
13. The fit / predict Mental Model
Suppose we build a logistic regression classifier.
from sklearn.linear_model import LogisticRegression

model = LogisticRegression()

model.fit(X_train, y_train)

predictions = model.predict(X_test)
Now try a decision tree:
from sklearn.tree import DecisionTreeClassifier

model = DecisionTreeClassifier()

model.fit(X_train, y_train)

predictions = model.predict(X_test)
The algorithm changed.
The basic workflow did not.
Create model
↓
Fit
↓
Predict
↓
Evaluate
This consistency allows researchers and students to compare multiple algorithms without rewriting the entire experiment. It reflects the API consistency highlighted in the original scikit-learn publication.
14. The Most Important scikit-learn Tool May Not Be an Algorithm
Beginners often rush toward:
Random Forest
SVM
Gradient Boosting
But one of the most valuable concepts in scikit-learn is the Pipeline.
Why?
Because preprocessing is part of the experiment.
Suppose we:
- fill missing values,
- standardise features,
- select variables,
- train a classifier.
If these operations are performed incorrectly before train/test separation or cross-validation, information can leak from evaluation data into training.
A pipeline helps keep transformations and modelling together in a reproducible sequence.
Conceptually:
Raw features
     ↓
Imputation
     ↓
Scaling
     ↓
Feature transformation
     ↓
Model
This is much closer to a real machine-learning system than simply writing:
model.fit(X, y)15. A Critical Correction: scikit-learn Is Not Automatically “Best for Tabular Data”
You will sometimes hear:
“scikit-learn is the best choice for tabular data.”
That is too broad.
Scikit-learn provides excellent implementations of many classical machine-learning algorithms and a consistent framework for preprocessing, model selection and evaluation.
But the best method depends on:
- dataset size,
- feature types,
- missingness,
- prediction objective,
- interpretability requirements,
- computational constraints,
- and competing algorithms.
The research mindset is not:
“Which library is best?”
It is:
“Which method performs appropriately under a controlled evaluation for this problem?”
16. Jupyter: The Laboratory Notebook of Data Science
Now we need somewhere to bring all these pieces together.
That is where Jupyter notebooks are useful.
A notebook allows you to combine:
code
results
plots
mathematical notation
explanatory text
in the same interactive document.
For exploratory analysis, this is extremely powerful.
Imagine working on our student-completion dataset.
One notebook might contain:
Research Question
      ↓
Load Data
      ↓
Inspect Dataset
      ↓
Clean Data
      ↓
Explore Distributions
      ↓
Visualize Relationships
      ↓
Train Baseline
      ↓
Evaluate
      ↓
Interpret Results
      ↓
Record Conclusions
The notebook becomes more than a place to run Python.
It becomes a record of the investigation.
17. But Jupyter Has a Hidden Danger
Interactive notebooks make experimentation easy.
That can also make experiments messy.
Suppose you execute:
Cell 7
then:
Cell 3
then modify:
Cell 2
then execute:
Cell 10
Your visible notebook may no longer represent the actual order in which the computational state was created.
This is why a notebook that “works on my laptop” is not automatically reproducible.
A useful discipline is:
Restart the environment and run the notebook from top to bottom before treating the result as final.
If it cannot reproduce its own results in a clean execution, the experiment needs work.
18. Notebook or Python Script?
This is not an either/or question.
Use notebooks for:
- exploration,
- teaching,
- visual analysis,
- rapid experiments,
- documenting reasoning.
Use modules/scripts for:
- reusable functions,
- production workflows,
- automated pipelines,
- testing,
- larger software systems.
A mature project may contain both:
project/
│
├── notebooks/
│   └── exploration.ipynb
│
├── src/
│   ├── preprocessing.py
│   ├── features.py
│   └── train.py
│
├── tests/
│
├── data/
│
└── requirements.txt
The notebook explores.
The codebase operationalises.
19. How the Toolkit Fits Together
We can now see the complete picture.
NumPy
Question: How do I perform numerical computation efficiently?
↓
pandas
Question: How do I organise, clean and transform tabular data?
↓
Matplotlib / Seaborn
Question: What does my data actually look like?
↓
scikit-learn
Question: Can I build and evaluate a predictive model?
↓
Jupyter
Question: How do I interactively conduct and communicate the experiment?
Together:
NumPy → pandas → Visualization → scikit-learn
with
Jupyter surrounding the experimental workflow
That is the core toolkit.
20. Let Us Build a Tiny End-to-End Experiment
Suppose we have:
students.csvwith:
study_hours
attendance
assignment_score
completed_course
First:
import pandas as pd

df = pd.read_csv("students.csv")
Inspect:
df.head()
df.info()
df.describe()
Visualise:
import seaborn as sns

sns.scatterplot(
    data=df,
    x="study_hours",
    y="assignment_score",
    hue="completed_course"
)
Prepare:
X = df[
    ["study_hours",
     "attendance",
     "assignment_score"]
]

y = df["completed_course"]
Split:
from sklearn.model_selection import train_test_split

X_train, X_test, y_train, y_test = train_test_split(
    X,
    y,
    test_size=0.2,
    random_state=42,
    stratify=y
)
Train:
from sklearn.linear_model import LogisticRegression

model = LogisticRegression()

model.fit(X_train, y_train)
Predict:
predictions = model.predict(X_test)Evaluate:
from sklearn.metrics import accuracy_score

accuracy = accuracy_score(
    y_test,
    predictions
)

print(accuracy)
We have just built a complete machine-learning experiment.
But have we done good research?
Not yet.
21. Code Running Successfully Is Not Evidence
This distinction is fundamental.
Suppose our model returns:
Accuracy = 0.91A beginner might conclude:
“Our model is 91% accurate.”
A researcher asks:
How many observations were tested?
How balanced were the classes?
What does a naive baseline achieve?
Would another split produce the same result?
Would precision, recall or another metric tell a different story?
Was preprocessing performed without leakage?
Does the sample represent the population where the model will be deployed?
Is there uncertainty around the estimate?
Python can calculate an accuracy score.
It cannot decide whether the experiment justifies the conclusion.
That requires statistical and scientific reasoning.
22. Add a Baseline Before Celebrating
Suppose:
91% of students complete the course.
A model that predicts:
“Everyone completes.”
achieves 91% accuracy.
Our apparently impressive model may therefore have learned almost nothing useful.
This is why machine-learning experiments should compare against sensible baselines.
For classification, that might include:
- majority-class prediction,
- logistic regression,
- or another simple benchmark.
Complexity should earn its place through evidence.
23. Reproducibility: The Difference Between a Demo and an Experiment
Imagine two students receive the same notebook.
Student A gets:
87% accuracy
Student B gets:
92%
Why?
Possible reasons include:
- different train/test splits,
- random initialization,
- package versions,
- preprocessing changes,
- different source data,
- or undocumented manual steps.
Research-quality data science should record enough information to make results traceable.
At minimum, consider preserving:
dataset/version
code
random seeds
library versions
preprocessing decisions
train/test methodology
evaluation metrics
This is where software engineering and scientific practice meet.
24. What About SciPy?
You may notice one major name missing from our “five essentials”:
SciPy.
SciPy is highly important in scientific Python and provides functionality for areas such as:
- optimization,
- integration,
- interpolation,
- signal processing,
- statistics,
- and scientific algorithms.
But for a beginner focused on data science and machine learning, you do not necessarily need to learn SciPy as a separate first step.
You will encounter it naturally as your work becomes more mathematically specialised.
So think of it as:
Essential ecosystem infrastructure, but not necessarily Lesson 1.
25. What About PyTorch and TensorFlow?
They matter enormously.
But they solve a different layer of the problem.
For introductory data science:
NumPy + pandas + visualization + scikit-learn
provides a strong foundation.
When you move toward:
- neural networks,
- computer vision,
- transformers,
- large language models,
- GPU training,
frameworks such as PyTorch become much more important.
Learning deep learning before becoming comfortable with arrays, data preparation and evaluation is rather like learning to fly before learning how instruments work.
Possible?
Perhaps.
Efficient?
Usually not.
26. What Should a Beginner Learn First?
Do not try to master every library.
Use this progression:
Stage 1 — Python fundamentals
Learn:
variables → lists → dictionaries → loops → functions → files
Then move quickly into data.
Stage 2 — NumPy
Learn:
arrays → shape → indexing → slicing → broadcasting → vectorization → aggregation
Stage 3 — pandas
Learn:
DataFrame → selection → filtering → missing values → groupby → merge → reshape
Stage 4 — Visualization
Learn:
histogram → scatter plot → box plot → bar chart → distributions → relationships
Stage 5 — scikit-learn
Learn:
train/test split → preprocessing → fit → predict → metrics → pipelines → cross-validation
Stage 6 — Reproducibility
Learn:
random seeds → environments → notebooks → scripts → version control → experiment documentation
Only after this foundation should the toolkit expand aggressively.
27. What You Do NOT Need to Memorise
Beginners often waste time memorising APIs.
Do not try to remember every:
pandas function
NumPy function
Matplotlib parameter
scikit-learn class
Professional developers look things up.
Researchers read documentation.
What matters is knowing:
What kind of operation do I need?
If you know that you need to join two tables, you can find merge.
If you know that you need grouped aggregation, you can find groupby.
If you know that you need cross-validation, you can find the appropriate scikit-learn API.
Conceptual understanding is more durable than syntax memorisation.
28. Five Common Beginner Mistakes
Mistake 1: Learning libraries without a problem
Watching 20 hours of pandas videos without analysing a dataset produces fragile knowledge.
Better: learn each tool while solving a real question.
Mistake 2: Jumping directly to machine learning
If you do not understand the dataset, sophisticated modelling rarely saves you.
Mistake 3: Treating visualization as decoration
A graph should answer a question.
Mistake 4: Reporting only accuracy
Metrics need context, baselines and appropriate evaluation.
Mistake 5: Treating a notebook as the finished product
Exploration is not the same as reproducible analysis or production software.
29. The Researcher’s View of the Python Toolkit
The libraries are tools.
The research process is what matters.
| Stage | Main Question | Typical Tool |
|---|---|---|
| Numerical computation | How can I manipulate numerical data efficiently? | NumPy |
| Data preparation | Is the dataset usable and correctly structured? | pandas |
| Exploration | What patterns and anomalies are present? | pandas + Seaborn |
| Visualization | How can I examine and communicate those patterns? | Matplotlib + Seaborn |
| Modelling | Can the data predict an outcome? | scikit-learn |
| Evaluation | Does the model generalise? | scikit-learn |
| Experimentation | Can I document and reproduce the analysis? | Jupyter + scripts |
This is the mental model I would want a beginner to retain.
30. A Better Definition of “Learning Python for Data Science”
Learning Python for data science does not mean:
Memorising NumPy, pandas and scikit-learn.
It means learning to move reliably through this chain:
Question
↓
Data
↓
Inspection
↓
Cleaning
↓
Exploration
↓
Hypothesis
↓
Model
↓
Evaluation
↓
Evidence
↓
Conclusion
Python is simply the language connecting those stages.
That is why the toolkit matters.
Key Takeaways
NumPy is the numerical foundation. It provides efficient multidimensional arrays and array-oriented computation and has become core infrastructure in scientific Python.
pandas makes tabular data practical. Its DataFrame-oriented tools address the real-world problem of manipulating labelled statistical datasets before analysis and modelling.
Matplotlib and Seaborn help you see the data. Matplotlib provides flexible plotting infrastructure, while Seaborn provides a higher-level statistical visualization interface integrated with pandas.
scikit-learn makes classical machine-learning experimentation accessible. Its consistent API supports supervised and unsupervised learning while emphasizing usability and performance.
Jupyter is excellent for exploration—but reproducibility requires discipline. A notebook should record an investigation, not become an excuse for hidden state and undocumented steps.
Most importantly:
The toolkit does not make the work scientific. The way you formulate the question, prepare the data, design the experiment, evaluate the result and report the evidence does.
That is the difference between running Python code and doing data science.
References
[1] Harris, C. R., Millman, K. J., van der Walt, S. J., et al. (2020). Array programming with NumPy. Nature, 585, 357–362. The paper describes NumPy’s array-programming model and its role as foundational infrastructure in the scientific Python ecosystem.
[2] McKinney, W. (2010). Data Structures for Statistical Computing in Python. Proceedings of the 9th Python in Science Conference. The original pandas paper discusses the need for practical data structures for statistical and tabular datasets.
[3] Hunter, J. D. (2007). Matplotlib: A 2D Graphics Environment. Computing in Science & Engineering, 9(3), 90–95. This is the canonical publication associated with Matplotlib.
[4] Waskom, M. L. (2021). seaborn: statistical data visualization. Journal of Open Source Software, 6(60), 3021. The paper describes Seaborn’s high-level, dataset-oriented statistical visualization interface and its relationship with Matplotlib and pandas.
[5] Pedregosa, F., Varoquaux, G., Gramfort, A., et al. (2011). Scikit-learn: Machine Learning in Python. Journal of Machine Learning Research, 12, 2825–2830. The paper describes scikit-learn’s goals of accessible machine learning, performance, documentation and API consistency.
[6] MIT OpenCourseWare. Introduction to Network Models — Python Resources. MIT course material describes Python as widely used in data-science applications and highlights its ecosystem of machine-learning and optimization libraries.
For readers who want the primary literature rather than secondary tutorials, the original NumPy research article in Nature, pandas paper from the SciPy proceedings, scikit-learn paper in JMLR, and Seaborn paper in JOSS are excellent starting points.
Next in the Python Series
From Raw CSV to Your First Machine-Learning Model in Python
The next article should move from toolkit to experiment.
Instead of introducing another set of libraries, we can take one real public dataset and build a complete reproducible workflow:
Load → Inspect → Clean → Explore → Visualize → Split → Preprocess → Baseline → Train → Evaluate → Interpret
We can deliberately introduce common mistakes—missing values, leakage, class imbalance and misleading accuracy—and show what happens when they are corrected.
That would turn this article’s central idea into practice:
Don’t learn Python libraries in isolation. Learn them by investigating a real problem.
Related Reading
- 10 Free Datasets Every ML Beginner Should Know — put these libraries to work on real, free datasets
- Getting Started with Statistics for Machine Learning — the statistical concepts to interpret what you build